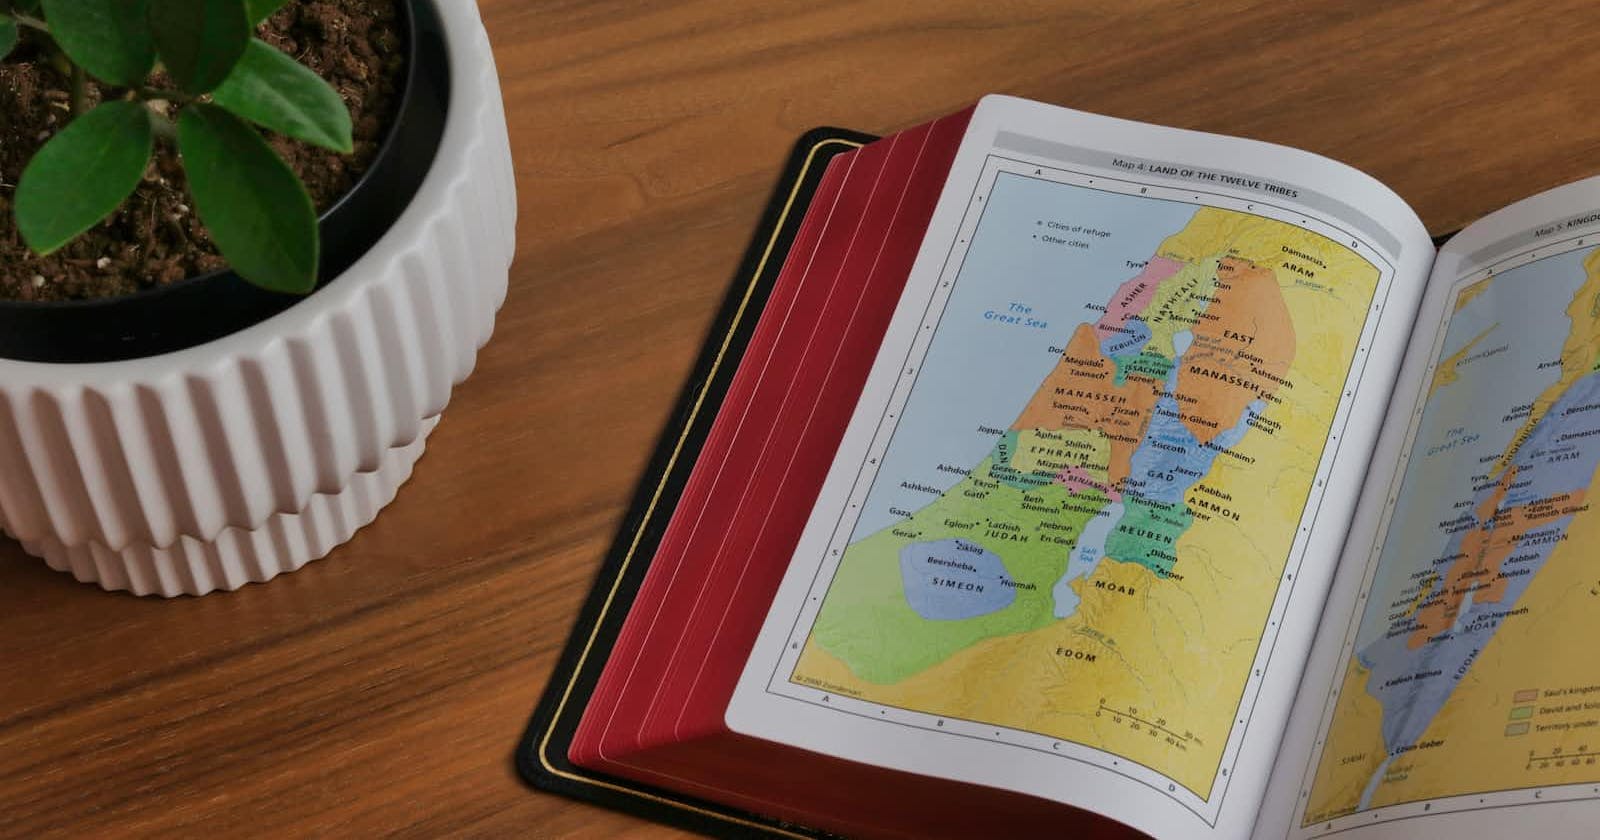
Photo by Humble Lamb on Unsplash
🗺️👀🌿 Creating Interactive Maps with Leaflet.js 🚀 #DataVisualizationSeries 📝 Part 2/10
Creating Interactive Maps with Leaflet.js
Introduction
Do you know how easy it is to create interactive maps for your web applications? With Leaflet.js, a lightweight and open-source JavaScript library, you can create beautiful and responsive maps that will enrich your user experience. In this article, we'll explore Leaflet.js, its features, and how you can use it to create interactive maps for your web projects. So, let's dive in!
1. What is Leaflet.js?
1.1. A Brief Overview
Leaflet.js is a popular open-source JavaScript library for creating interactive maps. It is designed to be lightweight, simple to use, and highly extensible, making it perfect for developers who want to create interactive maps without relying on heavy frameworks. Its small size and ease of use make it a popular choice among developers and designers alike.
2. Key Features of Leaflet.js
2.1. Lightweight and Fast
One of the biggest selling points of Leaflet.js is its lightweight nature. The library is only about 38 KB when minified and gzipped, making it faster to load and more performant than other mapping libraries like Google Maps API.
2.2. Mobile-Friendly
Leaflet.js is designed to work well on both desktop and mobile devices, ensuring a seamless experience across various platforms. It uses CSS3 transitions and hardware acceleration to provide smooth performance on mobile devices.
2.3. Highly Customizable and Extensible
Leaflet.js offers a wide range of customization options, allowing you to create unique maps that fit your specific needs. You can easily add custom markers, popups, and controls, as well as integrate with other mapping services and data sources.
3. Getting Started with Leaflet.js
3.1. Setting Up Your Project
To start using Leaflet.js, you'll need to include the library in your HTML file. You can download the latest version from the official website or include it via a CDN:
<!-- Include Leaflet.js CSS -->
<link rel="stylesheet" href="<https://unpkg.com/leaflet@1.7.1/dist/leaflet.css>" />

<!-- Include Leaflet.js JavaScript -->
<script src="<https://unpkg.com/leaflet@1.7.1/dist/leaflet.js>"></script>
3.2. Creating a Map Container
Next, you'll need to create a container for your map. This can be done using a simple <div> element with a unique ID and a specified width and height:
<div id="map" style="width: 100%; height: 400px;"></div>
3.3. Initializing the Map
Once you've set up the container, you can initialize your map using the following JavaScript code:
// Create a new map instance
var map = L.map('map').setView([51.505, -0.09], 13);
// Add a base layer to the map
L.tileLayer('https://{s}.tile.openstreetmap.org/{z}/{x}/{y}.png', {
attribution: '© <a href="<https://www.openstreetmap.org/copyright>">OpenStreetMap</a> contributors'
}).addTo(map);
4. Customizing Your Map
4.1. Adding Markers and Popups
You can easily add markers and popups to your map using the following code:
// Create a marker
var marker = L.marker([51.5, -0.09]).addTo(map);

// Attach a popup to the marker
marker.bindPopup("<b>Hello world!</b><br>I am a popup.").openPopup();
4.2. Customizing Markers
You can also customize your markers by changing their icon, size, and anchor point. To do this, create a new L.Icon instance with your desired options:
// Create a custom icon
var customIcon = L.icon({
    iconUrl: 'path/to/your/icon.png',
    iconSize: [38, 95], // size of the icon
    iconAnchor: [22, 94] // point of the icon which will correspond to marker's location
});

// Add a marker with the custom icon
var customMarker = L.marker([51.495, -0.099], {icon: customIcon}).addTo(map);
5. Adding Controls and Layers
5.1. Zoom Control
Leaflet.js provides built-in controls, such as the zoom control. To customize its position, use the following code:
// Change the position of the zoom control
map.zoomControl.setPosition('bottomright');
5.2. Layer Control
You can also add a layer control to your map, allowing users to switch between different base layers and toggle overlay layers:
// Create base layers
var streets = L.tileLayer('https://{s}.tile.openstreetmap.org/{z}/{x}/{y}.png', {
attribution: '© <a href="<https://www.openstreetmap.org/copyright>">OpenStreetMap</a> contributors'
});
var satellite = L.tileLayer('<https://server.arcgisonline.com/ArcGIS/rest/services/World_Imagery/MapServer/tile/{z}/{y}/{x}>', {
attribution: 'Tiles © Esri — Source: Esri, i-cubed, USDA, USGS, AEX, GeoEye, Getmapping, Aerogrid, IGN, IGP, UPR-EGP, and the GIS User Community'
});
// Create overlay layers
var pointsOfInterest = L.layerGroup([customMarker]);
// Add layers to the map
streets.addTo(map);
pointsOfInterest.addTo(map);
// Add a layer control
L.control.layers({
'Streets': streets,
'Satellite': satellite
}, {
'Points of Interest': pointsOfInterest
}).addTo(map);
6. Extending Leaflet.js with Plugins
Leaflet.js has a rich ecosystem of plugins that can extend its functionality. Some popular plugins include:
Leaflet.draw: Adds drawing and editing tools to your map
Leaflet.markercluster: Clusters nearby markers into a single marker for better performance and readability
Leaflet.heat: Displays heatmap data on your map
To use a plugin, simply include the plugin's CSS and JavaScript files in your HTML, and then follow the plugin's documentation to add the desired functionality to your map.
Conclusion
Creating interactive maps with Leaflet.js is both easy and fun. With its lightweight design, mobile-friendly approach, and a plethora of customization options, it's no wonder that Leaflet.js is a popular choice among developers. So, why wait? Start exploring Leaflet.js today and create engaging maps for your web applications!
FAQs
What is Leaflet.js?
Leaflet.js is an open-source JavaScript library for creating interactive maps. It is lightweight, mobile-friendly, and highly customizable.
Why should I use Leaflet.js instead of Google Maps API?
Leaflet.js is lighter and faster than Google Maps API, and it's open-source, which means you don't need to worry about usage limits or licensing fees.
How do I add controls and layers to my Leaflet.js map?
You can add controls, like the zoom control, by using built-in functions like
map.zoomControl.setPosition(). For layers, you can create base layers and overlay layers usingL.tileLayerandL.layerGrouprespectively, and then useL.control.layersto add a layer control to your map.Are there any plugins available for Leaflet.js?
Yes, there are many plugins available for Leaflet.js that extend its functionality. Popular plugins include Leaflet.draw, Leaflet.markercluster, and Leaflet.heat. To use a plugin, include the plugin's CSS and JavaScript files in your HTML, and follow the plugin's documentation to add the desired functionality to your map.
Can I use custom icons for my markers in Leaflet.js?
Yes, you can easily use custom icons for your markers by creating a new
L.Iconinstance with your desired options, such as icon URL, size, and anchor point.

